Getting Better at Getting Ready: Scenario Planning for Competitive Advantage

What if you had, ready at hand, an instruction book that told you exactly what to do in the event of any kind of emergency? You would feel more prepared to handle whatever challenge comes at you, wouldn’t you? Maybe you’d feel more confident knowing you always had a “plan B.” That’s what Scenario Planning is: an organization’s instruction book on how to handle major challenges. It’s the process of anticipating change before it happens and building an action plan for when it does. Read more here.

CA95F065-6CB6-4F54-853B-C2318735F81D.png

A Management Operating System

I would like to introduce a framework for thinking about Enterprise Performance Management and Business Intelligence. The genesis of this framework came from my days working at Hyperion Solutions (later acquired by Oracle Corp.). It’s been called a management “operating system” for your company because, like the operating system of your computer, it helps govern input and output and manage what applications (or decisions) are being run and helps make the most effective use of resources (memory, disk space, CPU cycles). You can start anywhere on this closed-loop process to tell the management operating system story, and today I’ll share Gather – the most common part of the cycle, with you.

Enterprise Performance Management, A Management Operating System, EPM, Ron Dimon

A Management Operating System

Gather – While you are busy running your business (Execution, which means service customers, making products, selling in markets), you are generating lots of data. You gather that data and transform it into useful information (according to its context) and deliver it to the right people (according to impact and areas of responsibility).

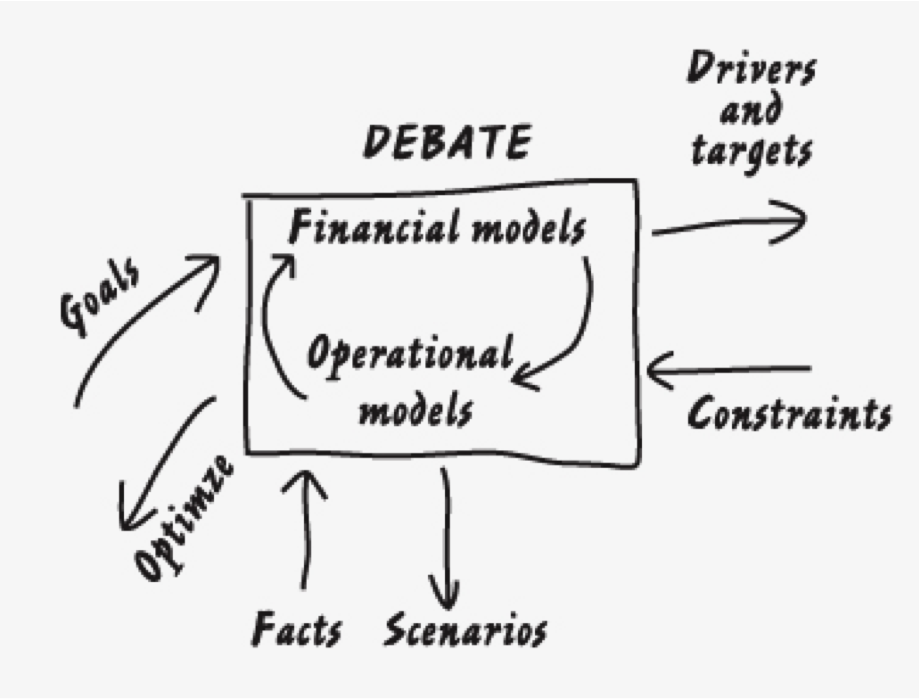
This is the place where managers consume reports about the results of the business. It’s where they answer the question “where are we, right now?” Depending on your industry and your business, there are generally two kinds of reports: mostly financial and mostly operational. The trend has been to combine financial and operational information on one report, which is a good idea since the two are interrelated: financial investments help drive operational results, and effective operations help contribute to financial performance.

Reports are delivered in a variety of formats with a variety of tools and can be categorized as:

  • Canned (static) reports
  • Ad hoc or interactive reports
  • Dashboards and scorecards
  • Spreadsheets

Reports give their readers a snapshot of what results have been produced to date to help them gauge how close to their goals and targets they are.

You can learn more about EPM and how it can help your organization build a common business process to execute its strategy in my book Enterprise Performance Management Done Right: An Operating System for Your Organization (Wiley CIO)

Choice

I was very happy to be selected as a delegate to the TEDxToronto 2013 Conference being held in September in my original home town.debate

The theme of the conference this year is “The Choices We Make.”  And while the conference presenters may focus on individual choice and social choice, I’ll be participating with my “organizational choice” hat on.  I’m very interested in how companies choose among an infinite number of options and scenarios on how to deploy resources, where to focus assets, and what day-to-day actions to take in order to further their strategic objectives and performance outcomes.

I like to think that nirvana is where a company has implemented a process of rigorous debate, supported by a culture of Read more of this post

What really constrains your performance?

Financial and operational planning processes, typically go like this: set targets, apportion the targets to different parts of the business, and then each part of the business further assigns a portion of the target down through their ranks.  Targets are usually set at the top (the board and the senior leadership team) and are usually derived using prior year performance plus a growth factor that’s been vetted by economic, market, and competitive models.  The apportionment can be done by geography (since North America delivered 60% of last year’s results, they get 60% of the targets this year), by product line (the WidgetMaster 5000 accounted for half of our sales, so it gets half of the goal for this year), by headcount, or some combination thereof.

The “ranks” receive their granular targets and sometimes get to negotiate their allotment and sometimes they don’t.  In a ‘top down’ plan, the likelihood of negotiating is low.  Some plans are created from the bottom up: each of the “ranks” looks at their patch and assess what they thing is possible and then all those assessments are consolidated (by geography, or product line, or combination) until you get the top-of-the-house target.  At that point, senior management pulls out the economic, market, and competitive models and compares it to the consolidated plan and then challenges the ranks to stretch what they think is possible and commit to a higher number than they came up with.

Enlightened organizations Read more of this post